
This page provides practical guidance on identifying common hotspots in CockroachDB clusters, using real-time monitoring and historical logs.
Signals to monitor
To identify a hotspot, monitor the following graphs on the DB Console Metrics page, as well as the following metrics on the DB Console Advanced Debug Custom Chart page.
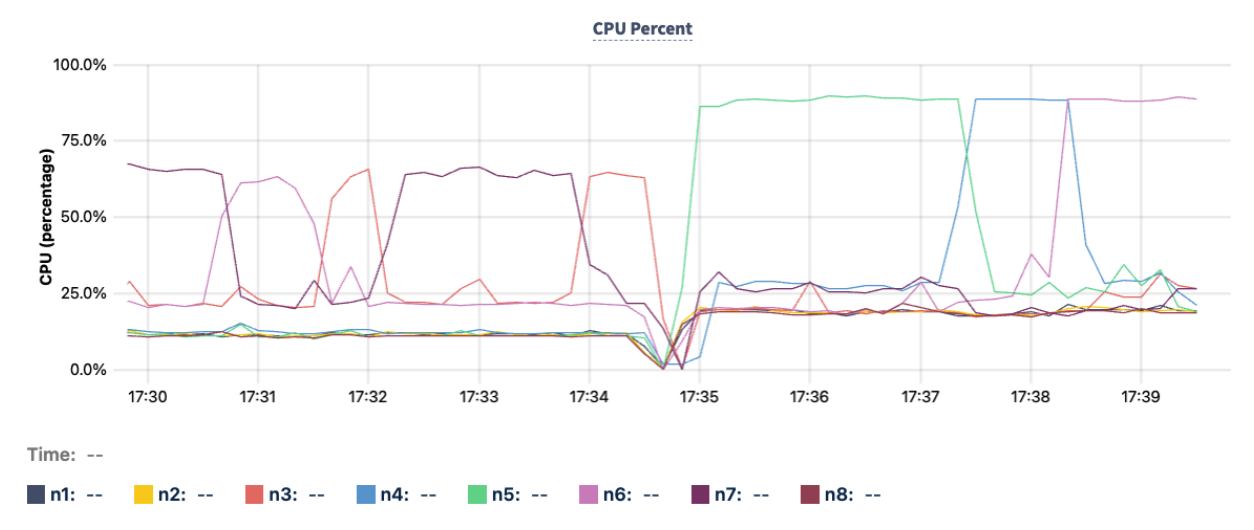
1. CPU percent
- On the DB Console Metrics page Hardware dashboard, monitor the CPU Percent graph.
- CPU usage increases proportionally with traffic.
- If the CPU usage of the hottest node is 20% or more above the cluster average, it may indicate a potential index hotspot or row hotspot (hot by read). Note the ID of the hot node.
- For example, node
n5, represented by the green line in the following CPU Percent graph, hovers at around 87% at time 17:35 compared to other nodes that hover around 20% to 25%.
2. Runnable Goroutines per CPU
- On the DB Console Metrics page Runtime dashboard, monitor the Runnable Goroutines Per CPU graph.
- A significant difference between the average and maximum values may indicate a potential index hotspot or row hotspot (hot by read). Note the ID of the hot node.
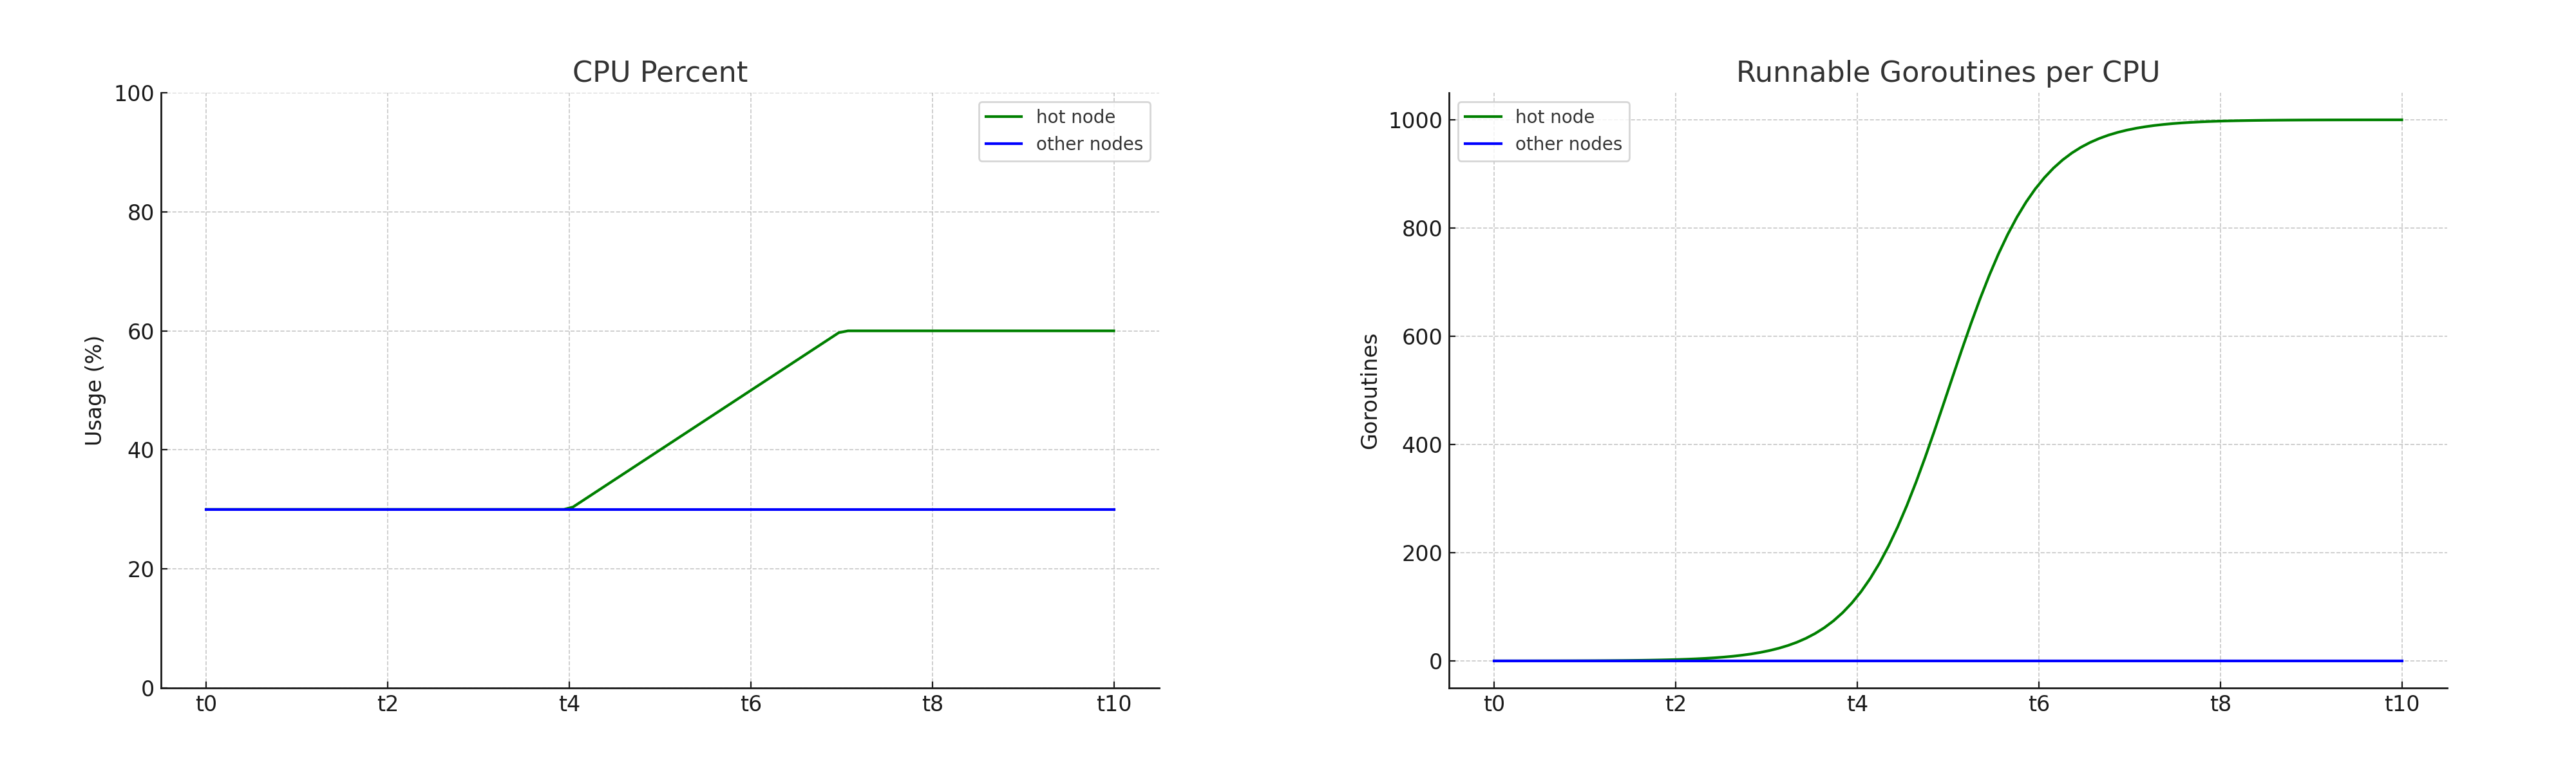
- Nodes typically hover near
0.0, unless a node is at or near its system-configured limit of 32. - The Runnable Goroutines per CPU graph rises more sharply than the CPU Percent graph. The goroutines graph only jumps up when a node approaches its limit, and then rises sharply. The following image shows the general shapes of the two graphs.
- For example, node
n5, represented by the green line in the following Runnable Goroutine per CPU graph, hovers above 3 at 17:35, compared to other nodes hovering around 0.0.
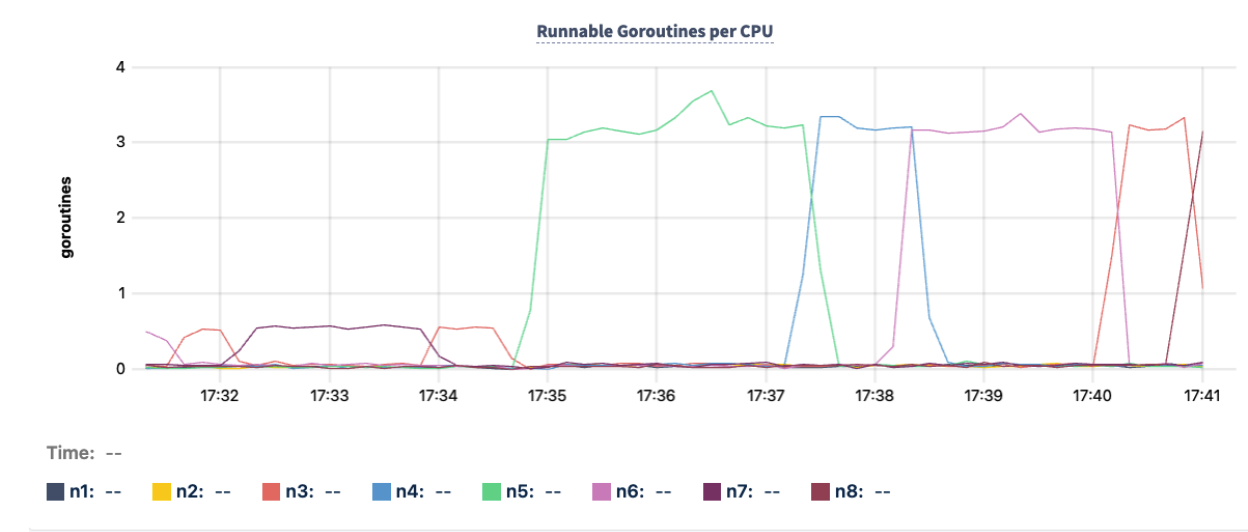
Compare the Runnable Goroutine per CPU graph and the CPU Percent graph at the same timestamp to spot sharp increases.
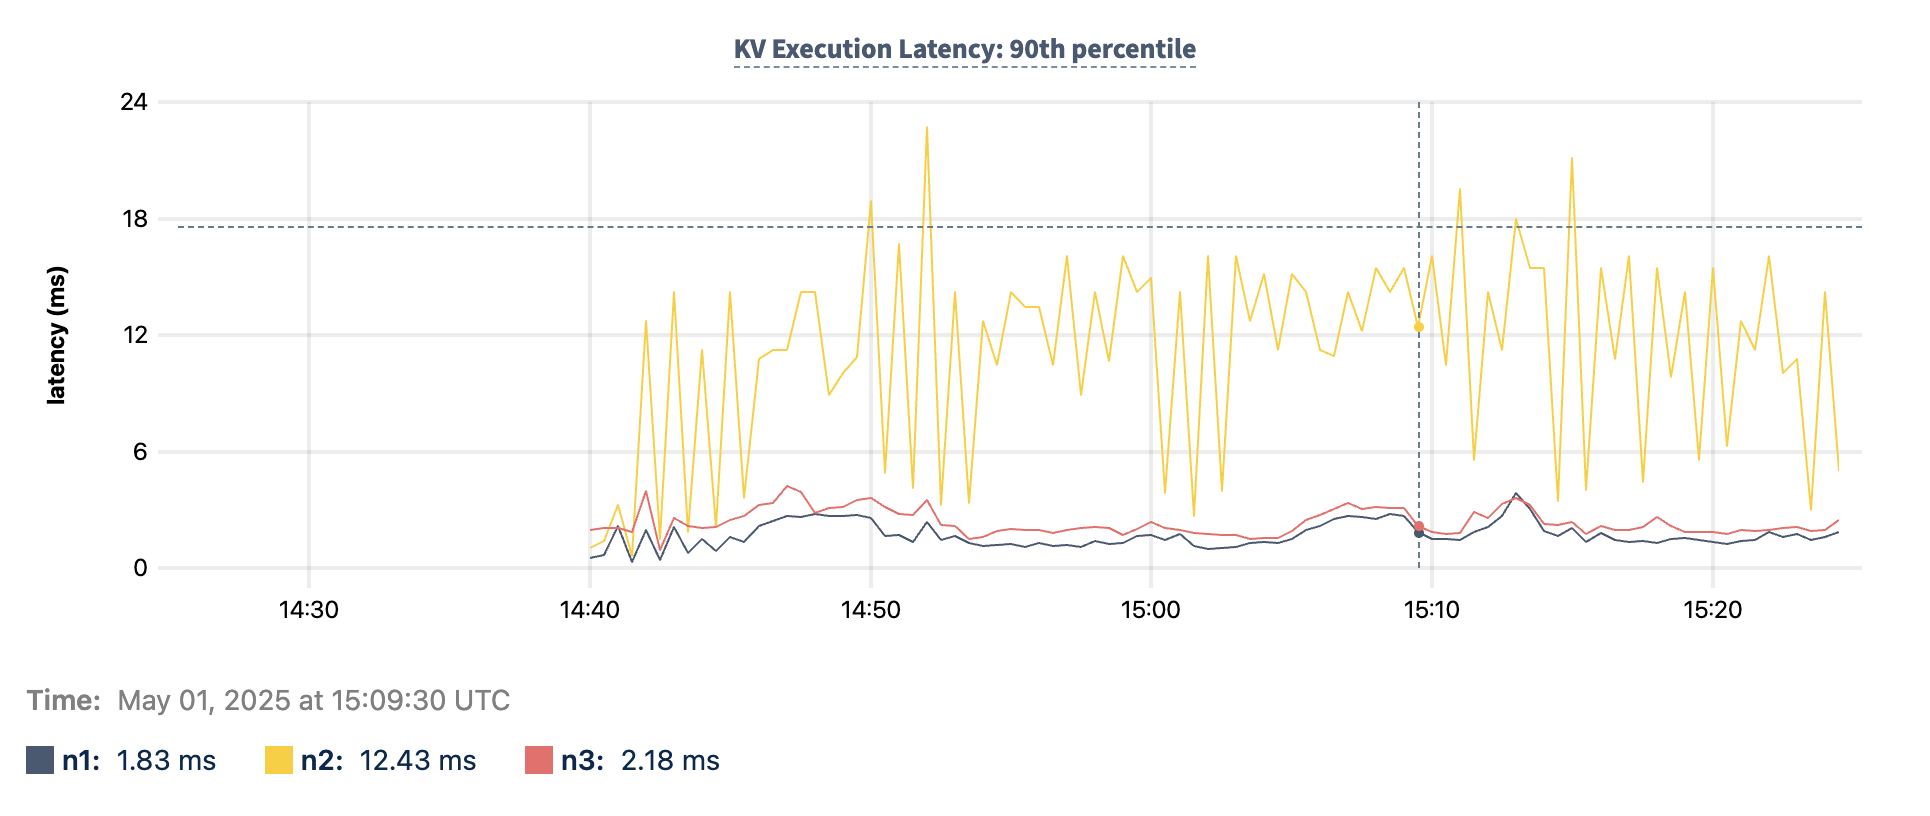
3. KV Execution Latency
- On the DB Console Metrics page SQL dashboard, monitor the KV Execution Latency: 90th percentile graph.
- A maximum value that is a clear outlier in the cluster may indicate a potential row hotspot (hot by write). Note the ID of the hot node.
4. Latch conflict wait durations
- On the DB Console Advanced Debug Custom Chart page, if a virtual cluster dropdown is present in the upper right corner, select
system. - Create a custom chart to monitor the
kv.concurrency.latch_conflict_wait_durations-avgmetric, which tracks time spent on latch acquisition waiting for conflicts with other latches. For example, a sequence writing to the same row must wait for the latch. - To display the metric per node, select the
PER NODE/STOREcheckbox.
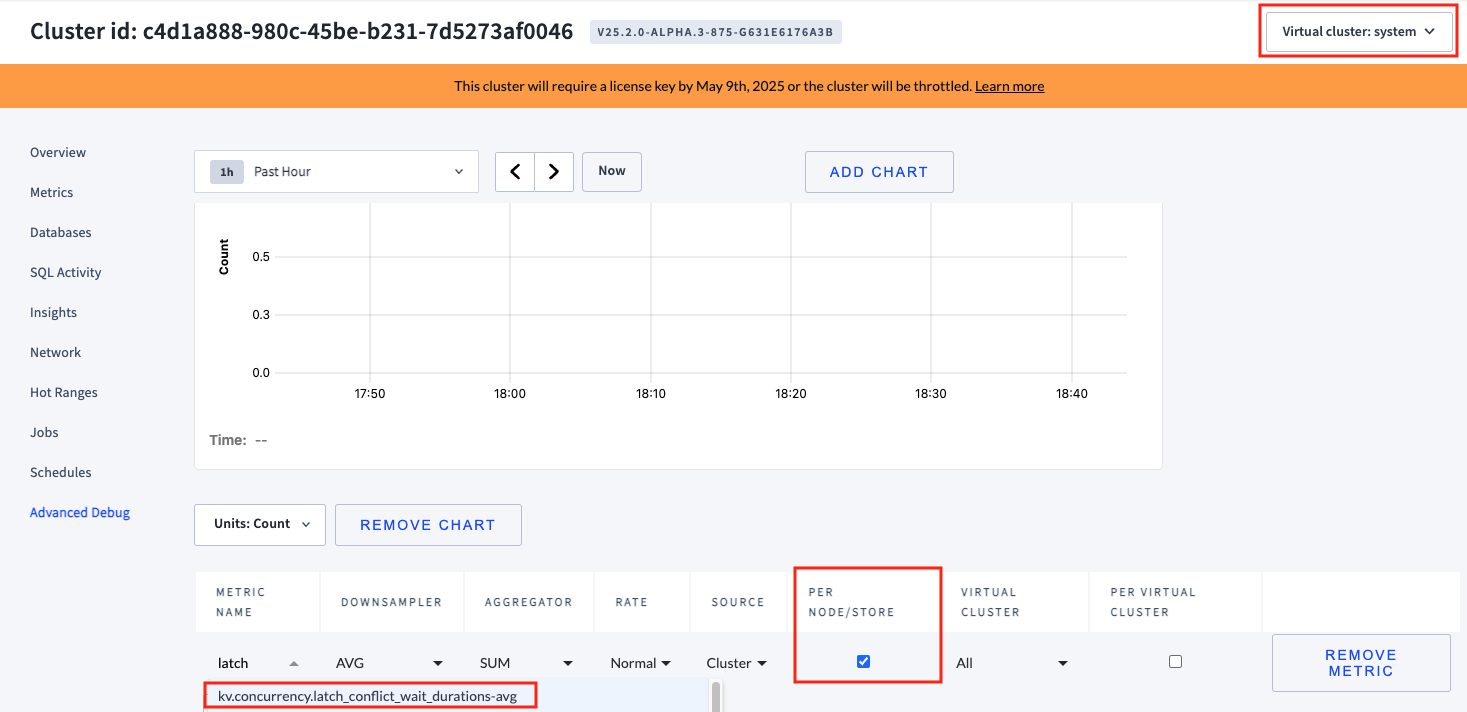
- A maximum value that is a clear outlier in the cluster may indicate a potential row hotspot (hot by write). Note the ID of the hot node.
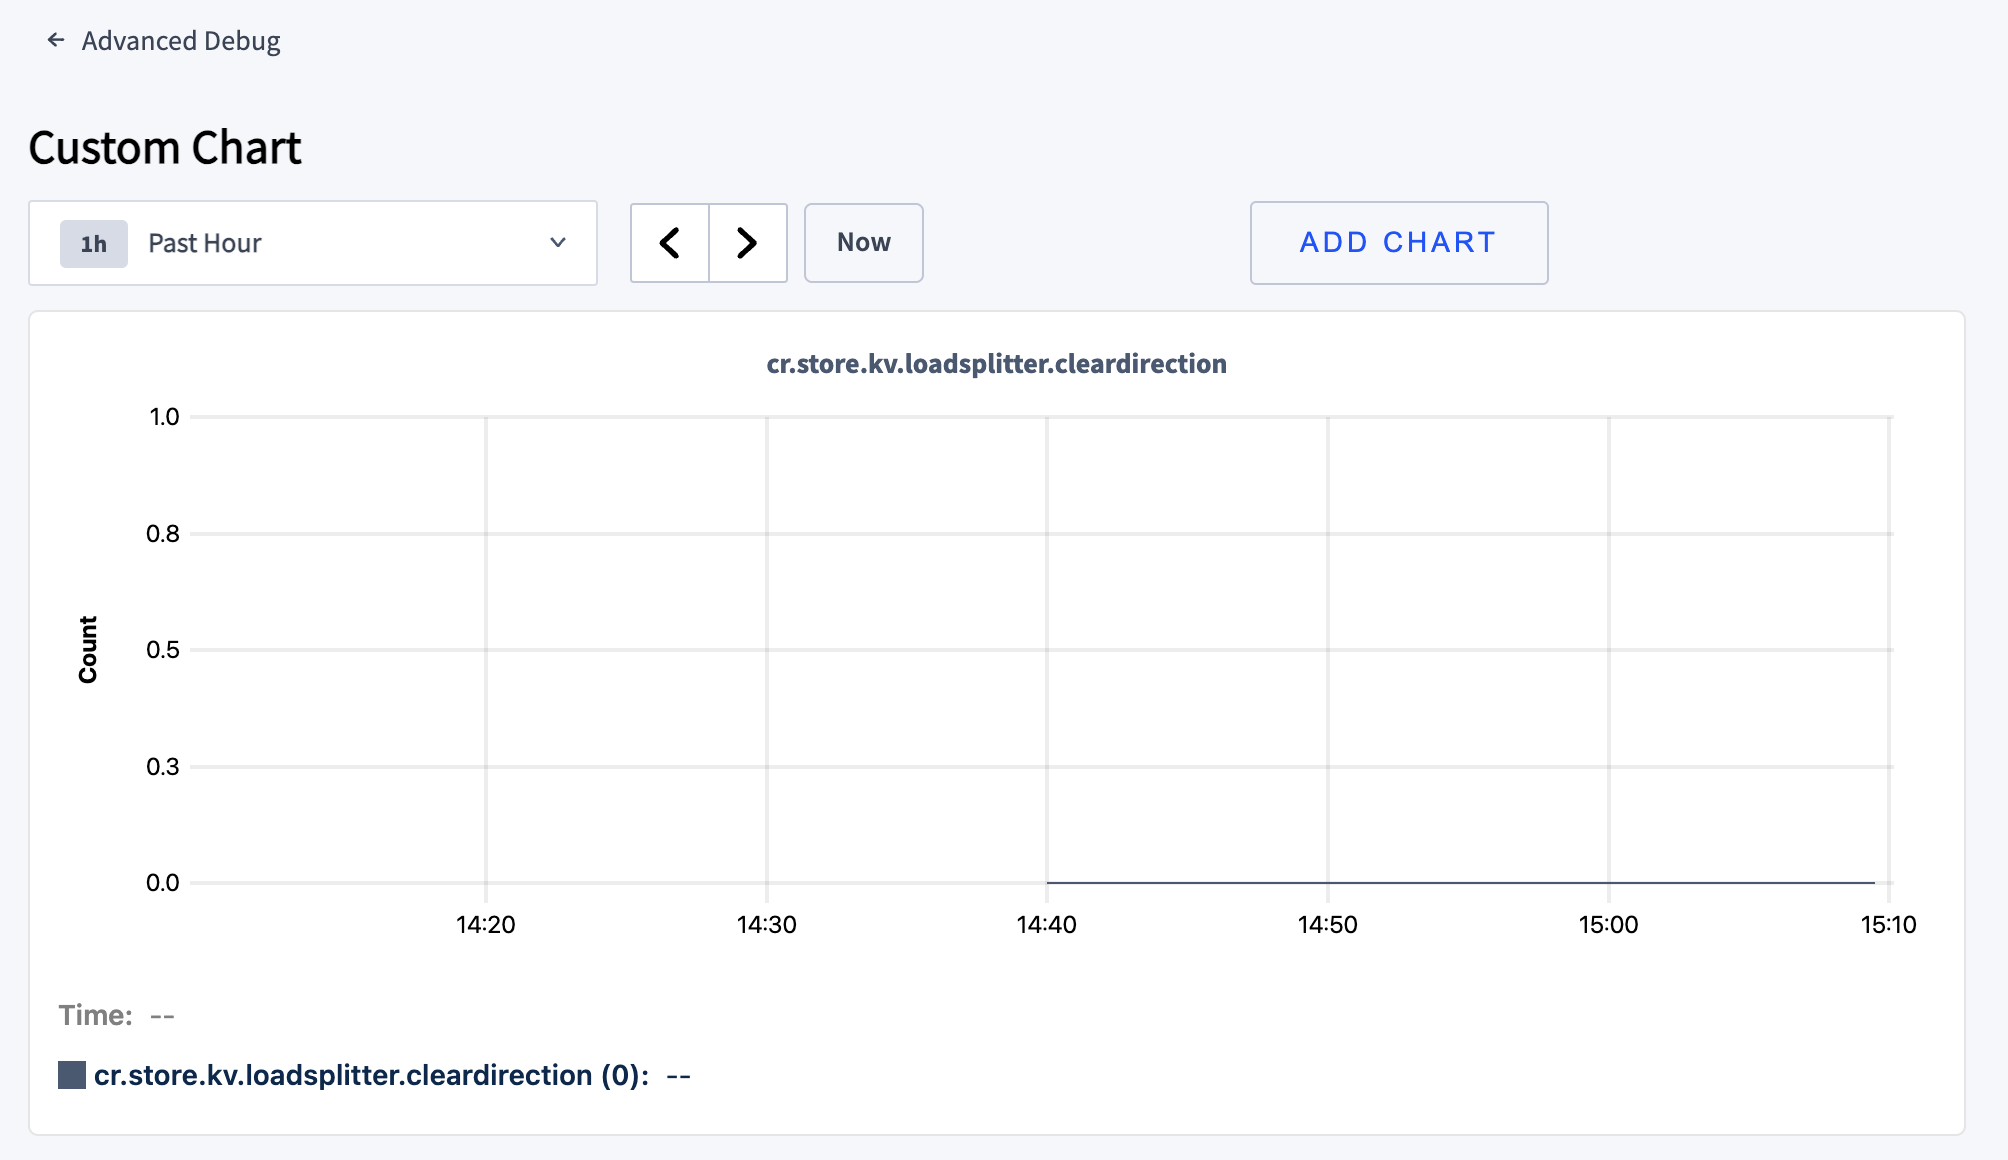
5. Clear direction
CockroachDB optimizes performance by splitting frequently accessed keys into smaller ranges. In conjunction with load-based rebalancing, load-based splitting distributes load evenly across your cluster.
- On the DB Console Advanced Debug Custom Chart page, if a virtual cluster dropdown is present in the upper right corner, select
system. - Create a custom chart to monitor the
kv.loadsplitter.popularkeymetric. This metric tracks whether the load-based splitter observed an access direction greater than 80% to the left or right in the samples. This indicates that the keys used by a replica increase or decrease steadily in one direction. - If this metric is non-zero, it may indicate a potential index hotspot.
6. Popular key
- On the DB Console Advanced Debug Custom Chart page, if a virtual cluster dropdown is present in the upper right corner, select
system. - Create a custom chart to monitor the
kv.loadsplitter.popularkeymetric. This metric tracks whether the load-based splitter could not find a split key, and the most frequently sampled split key appears in over 25% of the samples. In a given replica, one key may receive most of the traffic. - If this metric significantly increases, it may indicate a potential row hotspot (hot by read) or row hotspot (hot by write).
Hotspot type
Once you have checked the graphs described in Signals to monitor, identify the type of hotspot occurring in your cluster.
Index hotspot
If the following combination of graphs indicates a hotspot:
the hotspot is likely to be an index hotspot.
Row hotspot, hot by read
If the following combination of graphs indicates a hotspot:
the hotspot is likely to be a row hotspot that is hot by read.
Row hotspot, hot by write
If the following combination of graphs indicates a hotspot:
the hotspot is likely to be a row hotspot that is hot by write.
Location of hotspot
Once you have determined the type of hotspot, locate the index or row causing the hotspot using the Hot Ranges page and logs, if applicable.
Hot Ranges page
Navigate to the DB Console Hot Ranges page to identify the corresponding hot index. For row hotspots—either hot by read or hot by write—the Hot Ranges page can help locate the table and index associated with the affected row.
- Sort the results by either of the following columns in descending order:
- The CPU column that represents CPU time, measured in milliseconds used per second, compared to the CPU Percent graph which is percent usage. The per-second rate is averaged over the last 30 minutes.
- The Write (bytes) column that represents the total number of bytes written per second on this range. The per-second rate is averaged over the last 30 minutes.
- Correlate the node ID listed in the Leaseholder column with the suspected node noted from the signal graphs.
- If a correlation is found:
- Note the range in the Range ID column.
- Scroll to the right side of the page to find the Table and Index columns, which identify the table and index associated with that range ID.
Focus on correlating spikes in the CPU Percent or Runnable Goroutines per CPU graphs with specific index usage to confirm the index hotspot.
Once you have determined the table and index, run the SQL statement SHOW CREATE TABLE to inspect the schema for the identified table and index.
hot_ranges_stats logs
Under certain circumstances, an event of type hot_ranges_stats will be emitted for a hot range. While the Hot Ranges page contains real-time information for all the nodes of the cluster, the hot_ranges_stats logs contain historical information only for the given node. This event type is logged to the HEALTH channel.
Clear direction logs
The clear direction log is not connected to an event, but has an unstructured message similar to this:
access balance between left and right for sampled keys: left-biased 85%
Popular key logs
The popular key log is not connected to an event, but has an unstructured message similar to this:
no split key found: insufficient counters = 6, imbalance = 14, most popular key occurs in 46% of samples
Performance Benchmarks and Limitations
During internal testing (row sizes 256–512 bytes) on an N2-standard-16 machine:
| Category | Performance Limit |
|---|---|
| Index Hotspot | ~22,000 inserts per second |
| Row Hotspot (Writes) | ~1,000 writes per second |
| Row Hotspot (Reads) | ~70,000 reads per second |
The larger the cluster, the easier it is to detect hotspots due to clearer outliers.
See also
- Understand Hotspots
- DB Console Metrics page
- DB Console Advanced Debug Custom Chart page
- Hot Ranges page
Was this helpful?