
This page provides practical guidance on identifying common hotspots in CockroachDB clusters using real-time monitoring and historical logs. This tutorial assumes that you have identified a metrics outlier in your cluster. It focuses on CPU and latch contention metrics to help you identify hot key and hot index scenarios.
Before you begin
- Review the Understand hotspots page for definitions and concepts.
- Ensure you have access to the DB Console Metrics and the relevant logs.
Troubleshooting overview
The following sections provide detailed instructions for identifying potential hotspots and applying mitigations.

Step 1. Check for a node outlier in metrics
To identify a hotspot, monitor the following metrics on the DB Console Metrics page and the DB Console Advanced Debug Custom Chart page. A node with a maximum value that is a clear outlier in the cluster may indicate a potential hotspot.
A. Latch conflict wait durations
- Navigate to the DB Console Advanced Debug Custom Chart page.
- Create a custom chart to monitor the
kv.concurrency.latch_conflict_wait_durations-avgmetric, which tracks time spent on latch acquisition waiting for conflicts with other latches. For example, a sequence that writes to the same row must wait to acquire the latch. To display the metric per node, select the
PER NODE/STOREcheckbox as shown: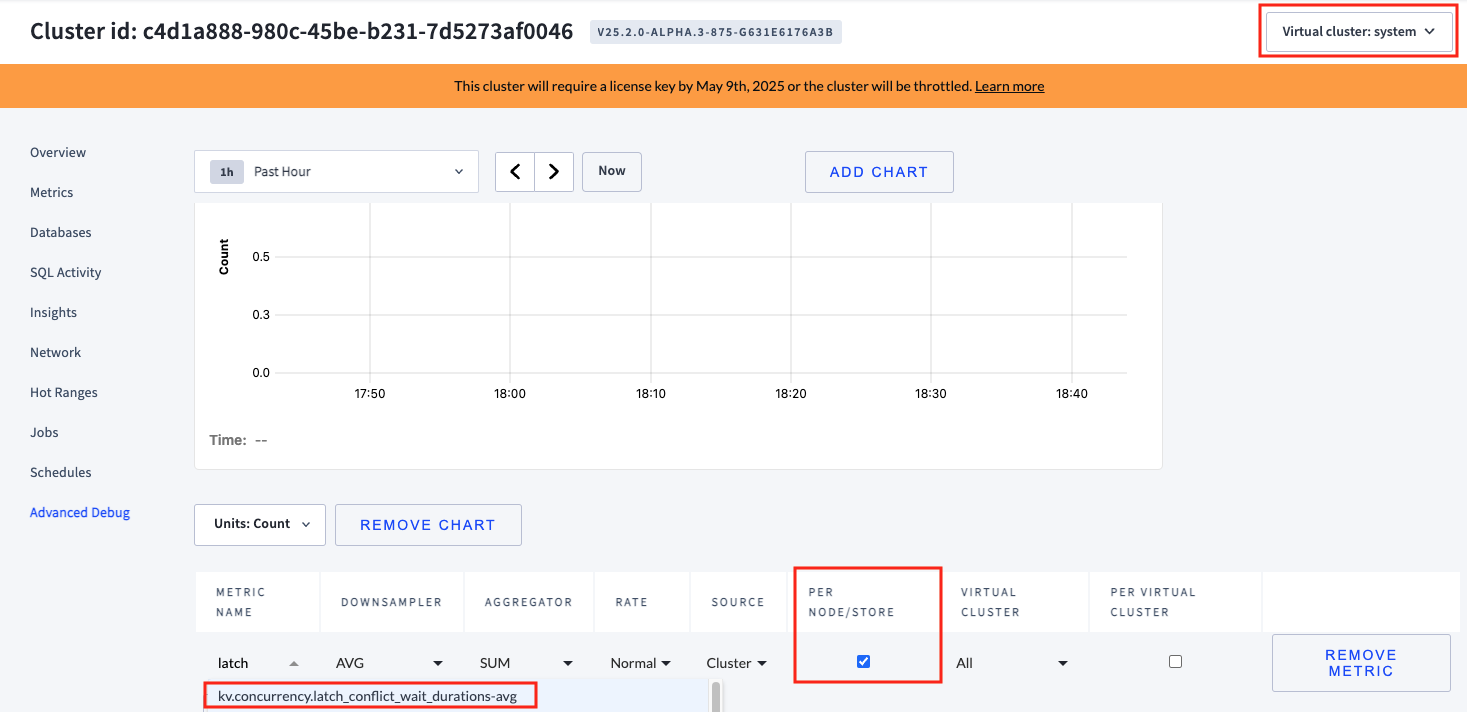
Is there a node with a maximum value that is a clear outlier in the cluster for the latch conflict wait durations metric?
- If Yes, note the ID of the hot node and the time period when it was hot. Proceed to check for a
popular key detectedlog. - If No, check for a node outlier in the CPU percent metric.
- If Yes, note the ID of the hot node and the time period when it was hot. Proceed to check for a
B. CPU percent
- Navigate to the DB Console Metrics page Hardware dashboard.
- Monitor the CPU Percent graph. CPU usage typically increases with traffic volume.
Check if the CPU usage of the hottest node is 20% or more above the cluster average. For example, node
n5, represented by the green line in the following CPU Percent graph, hovers at around 87% at time 17:35 compared to other nodes that hover around 20% to 25%.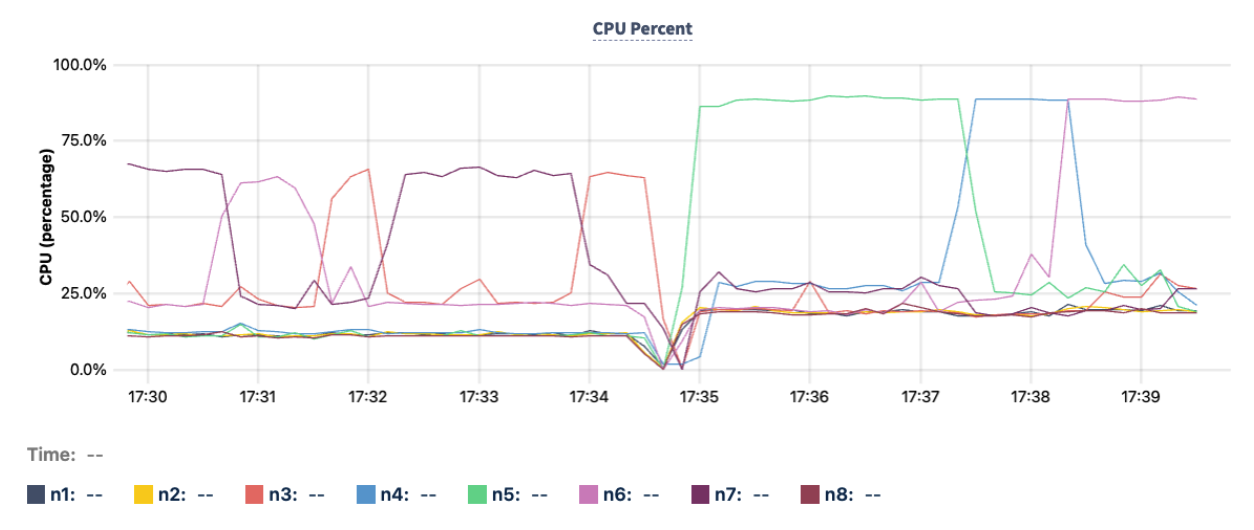
Is there a node with a maximum value that is a clear outlier in the cluster for the CPU percent metric?
- If Yes, note the ID of the hot node and the time period when it was hot. Proceed to check for a
popular key detectedlog. - If No, and the metrics outlier appears in a metric other than CPU percent or latch conflict wait duration, consider causes other than a hotspot.
- If Yes, note the ID of the hot node and the time period when it was hot. Proceed to check for a
Step 2. Check for existence of no split key found log
The no split key found log is emitted in the KV_DISTRIBUTION log channel. This log is only emitted when a single replica begins using a significant percentage of the resources on the node where it resides.
This log is not associated with a specific event type but includes an unstructured message, for example:
I250523 21:59:25.755283 31560 13@kv/kvserver/split/decider.go:298 ⋮ [T1,Vsystem,n5,s5,r1115/3:‹/Table/106/1/{113338-899841…}›] 2979 no split key found: insufficient counters = 0, imbalance = 20, most popular key occurs in 36% of samples, access balance right-biased 98%, popular key detected, clear direction detected
In the preceding log example, the square-bracketed tag section provides the following information:
- Node ID:
n5indicates the Node ID is 5. - Range ID:
r1115indicates the Range ID is 1115.
The timestamp at the beginning of the log is 250523 21:59:25.755283.
The unstructured message ends with one of the following strings:
popular key detected, clear direction detectedpopular key detected, no clear directionno popular key, clear direction detectedno popular key, no clear direction
A. popular key detected
The popular key detected log indicates that a significant percentage of reads or writes target a single row within a range.
To check for a
popular key detectedlog, search theKV_DISTRIBUTIONlogs on the hot node from Step 1 within the noted time period.Once you identify a relevant log, note the range ID in the tag section of the log.
If the outlier appears in the latch conflict wait durations metric, does a
popular key detectedlog exist?- If Yes, it may be a write hotspot. Note the range ID of
popular key detectedlog and proceed to find the corresponding hot ranges log. - If No, investigate other reasons for the latch conflict wait durations metric outlier.
- If Yes, it may be a write hotspot. Note the range ID of
If the outlier appears in the CPU percent metric, does a
popular key detectedlog exist?- If Yes, it may be a read hotspot, because the write hotspot was ruled out when no outlier was found in the latch conflict wait durations metric. The order of operations in this troubleshooting process matters. Note the range ID of
popular key detectedlog and proceed to find the corresponding hot ranges log. - If No, check whether a
clear direction detectedlog exists.
- If Yes, it may be a read hotspot, because the write hotspot was ruled out when no outlier was found in the latch conflict wait durations metric. The order of operations in this troubleshooting process matters. Note the range ID of
B. clear direction detected
The clear direction detected log indicates that the rows touched in the range are steadily increasing or decreasing within the index.
To determine whether a
clear direction detectedlog exists, check whether anyno split key foundlogs for the hot node identified in Step 1, within the noted time period, have an unstructured message that ends withclear direction detected.Does a
clear direction detectedlog exist?- If Yes, it may be an index hotspot. Note the range ID of
clear direction detectedlog and proceed to find the corresponding hot ranges log. - If No, investigate other possible causes for CPU skew.
- If Yes, it may be an index hotspot. Note the range ID of
Step 3. Find hot ranges log
A hot ranges log is a log of an event of type hot_ranges_stats emitted to the HEALTH logging channel. Because this log corresponds to an event type, it includes a structured message such as:
I250602 04:46:54.752464 2023 2@util/log/event_log.go:39 ⋮ [T1,Vsystem,n5] 31977 ={"Timestamp":1748839613749807000,"EventType":"hot_ranges_stats","RangeID":1115,"Qps":0,"LeaseholderNodeID":5,"WritesPerSecond":0.0012048123820978134,"CPUTimePerSecond":251.30338109510822,"Databases":["kv"],"Tables":["kv"],"Indexes":["kv_pkey"]}
- To find the relevant hot ranges log, within the noted time range of the metric outlier, search for
"EventType":"hot_ranges_stats"and"RangeID":{range ID from popular key detected log or clear direction log}and"LeaseholderNodeID":{node ID from metric outlier}.
- Once you find the relevant hot ranges log, note the values for
Databases,Tables, andIndexes. - For a write hotspot or read hotspot, proceed to Mitigation for hot key.
- For an index hotspot, proceed to Mitigation for hot index.
Mitigation 1 - hot key
To mitigate a hot key (whether a write hotspot or read hotspot), identify the problematic queries and refactor your application accordingly. Use the Databases, Tables, and Indexes values from the hot ranges log to filter the following DB Console pages by the time period of the metric outlier and log emission:
- The Databases Index Details page includes an Index Usage section that shows statement fingerprints using that index.
- The SQL Activity Statements page shows statement fingerprints that can be filtered.
Mitigation 2 - hot index
To mitigate a hot index, update the index schema using the values noted for Databases, Tables, and Indexes in the hot ranges log. Refer to Resolving index hotspots.
See also
- Understand Hotspots
- Reduce hotspots
- Metrics page
- Advanced Debug Custom Chart page
- Logging channels
- Load-based splitting
- SQL Activity Statements page
- Databases Index Details page
Was this helpful?